- About NEPAssist
- Selecting a Study Area
- Viewing Map Features
- Identifying Map Features
- Define Report Area
- NEPAssist Report
- Understanding the Data
- Other Tools
About NEPAssist
NEPAssist is a tool that facilitates the environmental review process and project planning in relation to environmental considerations. The web-based application draws environmental data dynamically from Geographic Information System databases and web services and provides immediate screening of environmental assessment indicators for a user-defined area of interest. These features contribute to a streamlined review process that potentially raises important environmental issues at the earliest stages of project development.
To access NEPAssist,
- Request a user account.
- Request the Url for NEPAssist.
- Run the NEPAssist application with a web browser.
Selecting a Study Area
To get started, please select a location or enter a pair of latitude and longitude coordinates. If the Bing Maps search option is available, you can simply enter a location in the search box. Click "Buscar" to submit your selection.
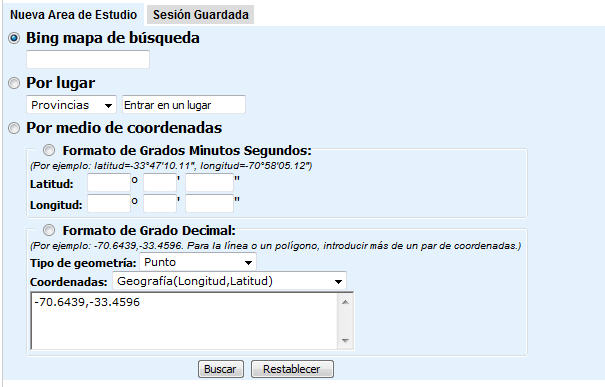
Coordinates
To search by coordinates in degrees, minutes, seconds format, enter the coordinates in the appropriate boxes.
To search by coordinates in demimal format,
- Choose the type of geometry (point, line, or polygon) from the first drop-down menu.
- Choose the formatting of coordinates in the second drop-down menu.
- Type the coordinates in the selected format with a comma separating each
coordinate.
- For drawing lines or polygons, enter more than one pair of coordinates.
- For Geografia (Longitude, Latitud), enter the coordinates with the longitude first followed by the latitude using a comma to separate the two. Example: -70.1936, 18.6992.
- For any other coordinate systems, enter the coordinates accordingly.
Using the Mapper Search Tool
Once you enter NEPAssist, you can use this tool ( )
to search for a new location by province or municipality. Select the search
category, then enter a string in the text box. As you type, suggestions will
appear automatically.
)
to search for a new location by province or municipality. Select the search
category, then enter a string in the text box. As you type, suggestions will
appear automatically.
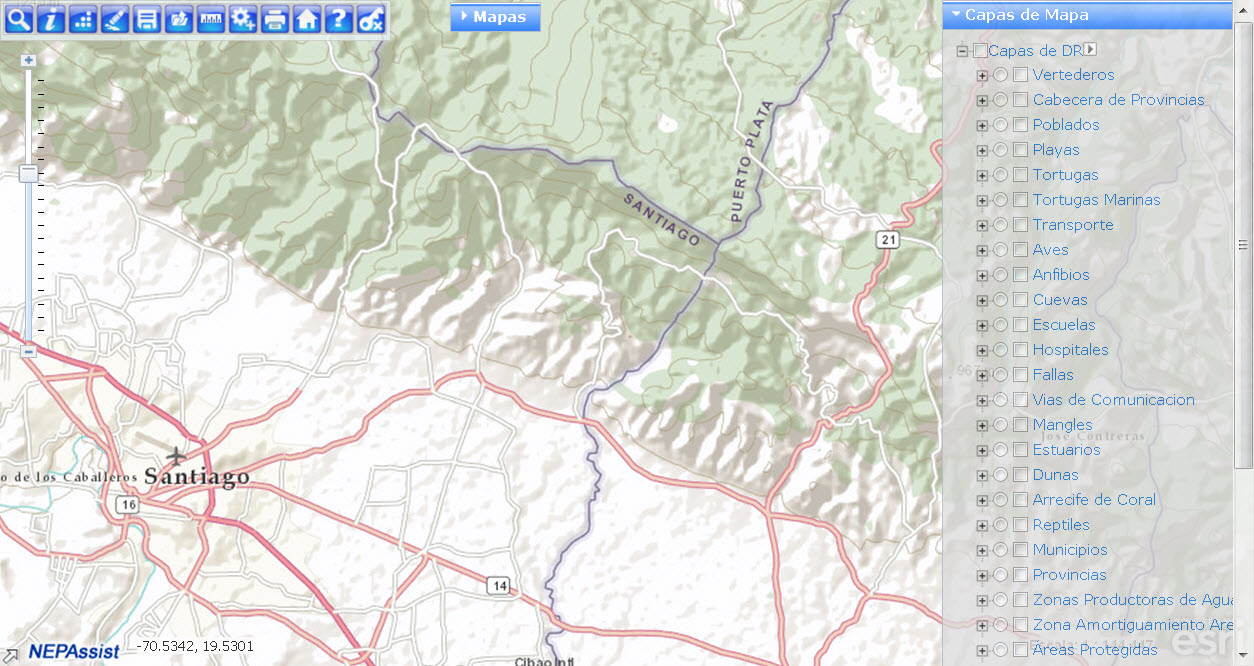
Viewing Map Features
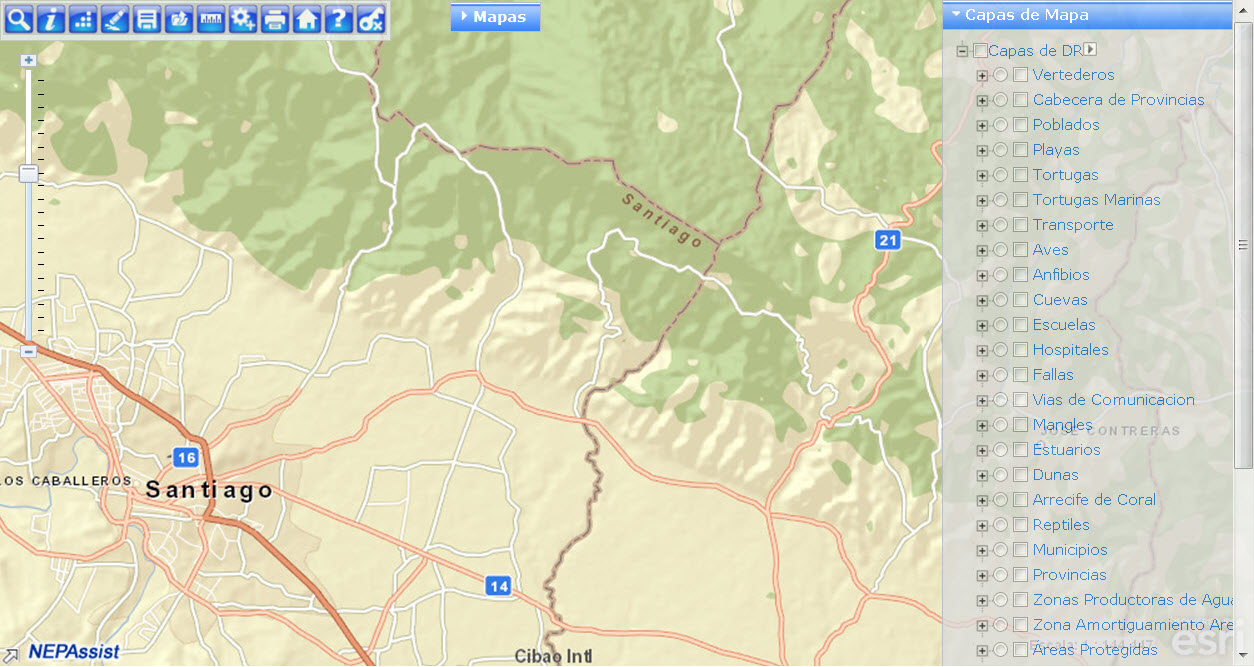
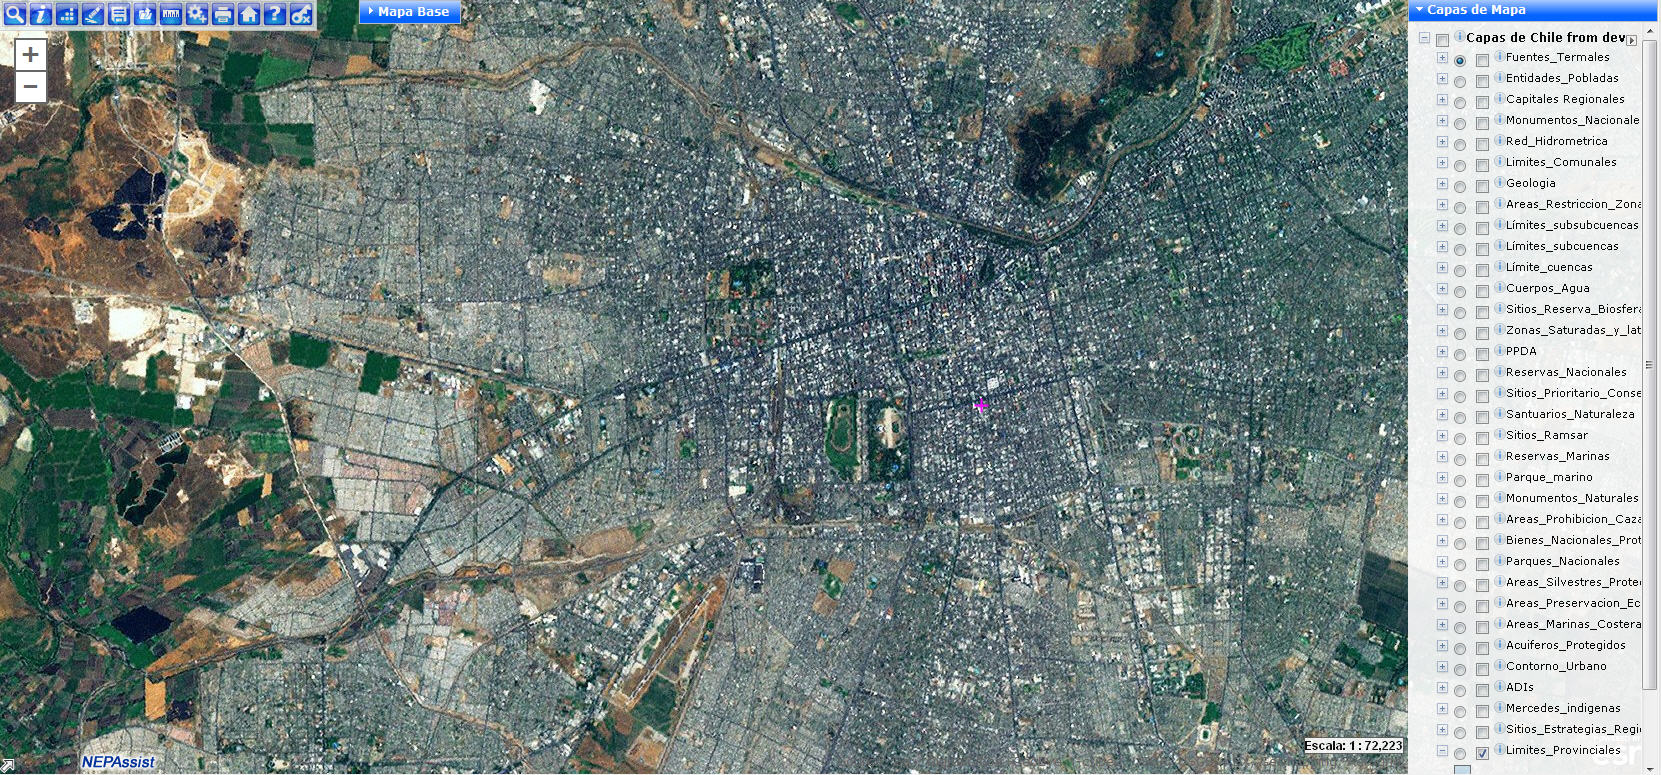
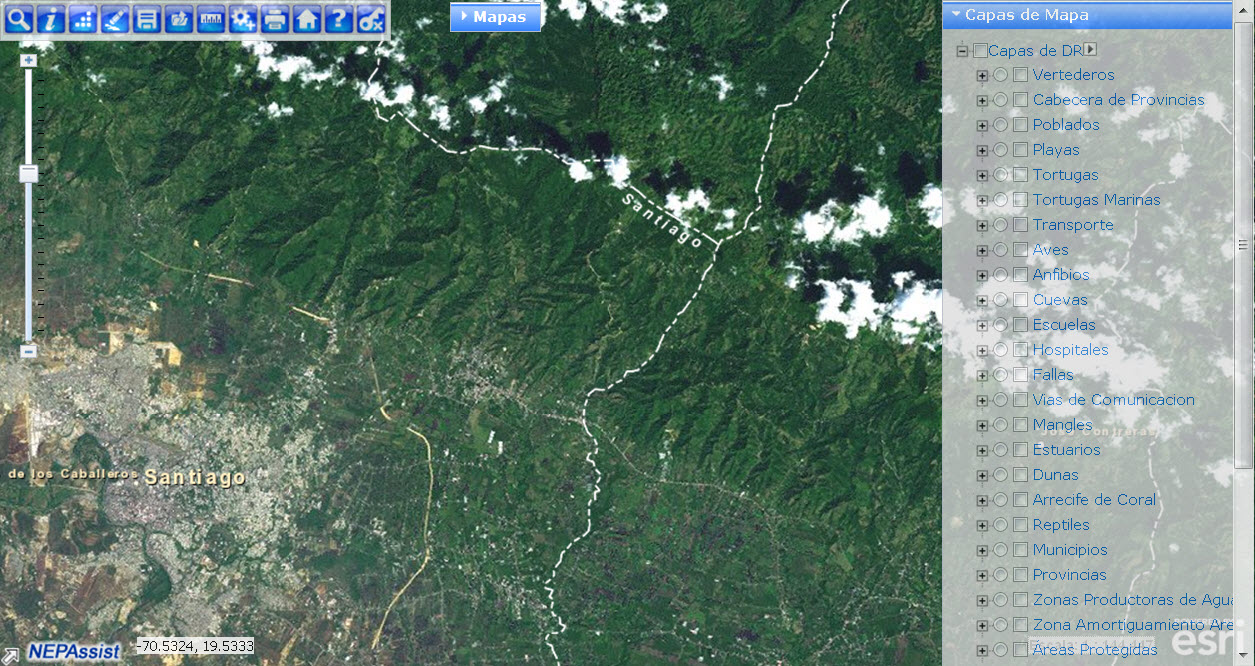
Depending on the location you have selected to study, multiple map views may be available. All views are located along the toolbar under the button "Mapa Base".
Depending on the selected study area, these views are available:
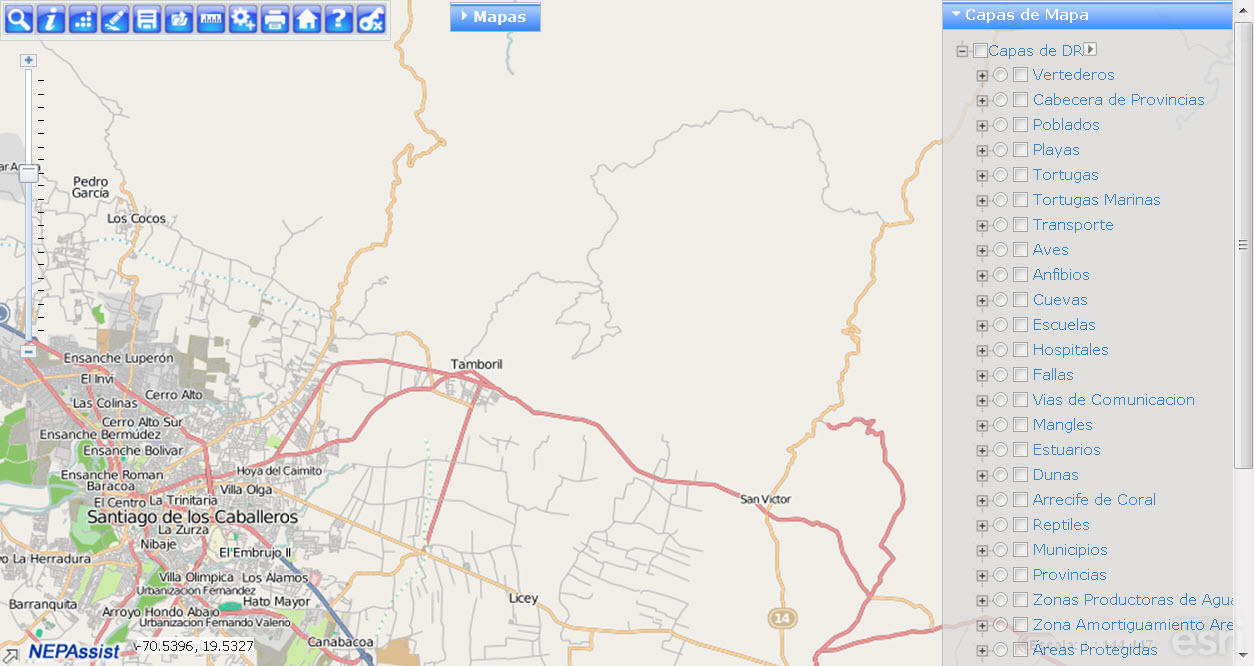
Some things to note:
-
As you zoom in or out, some features become unavailable because they depend on the scale of the current map window. When this happens, the option under "Select Map Contents" will be disabled and the feature will not be displayed on the map, even if it was selected before you zoomed in or out.
-
Also, as you zoom out, facilities that are close together become clustered. When you mouse over them, you will see a list of sites in the bunch and as you zoom in, the sites will begin to separate.
- The order in which the layers are shown on the map will depend on the order in which they are added. Turn layers on/off to change the order in which they display on the map. If you zoom in or out, the order shown may change depending on the order in which the data is retrieved.
Identifying Map Features
In NEPAssist, you can identify additional information on map features using the following methods:
To use the Identify Tool
- First click the (
 )
button to open the Identify Tool.
)
button to open the Identify Tool.
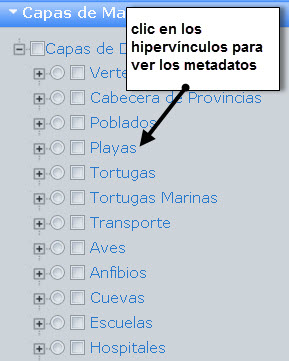
- Click on the radio button (
 ) of the data feature you want to identify in the Map
Layers.
) of the data feature you want to identify in the Map
Layers. 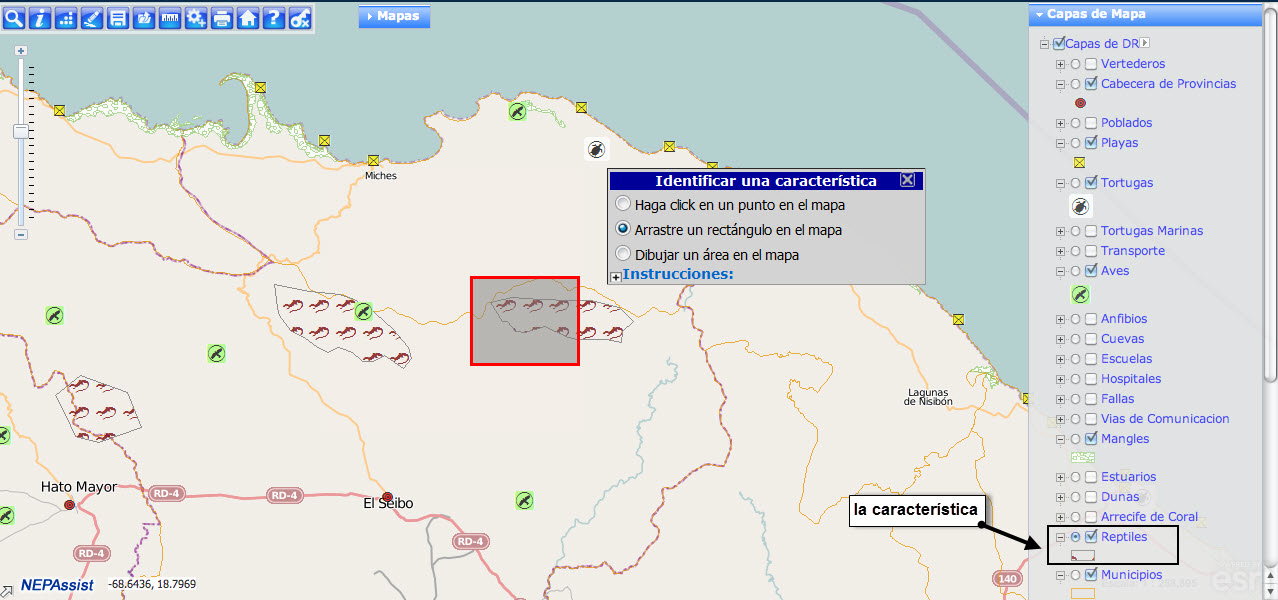
- In the Identify Tool window, there are three options: point, rectangle,
and custom area.
- Point - click on the data feature you want to identify on the map to provide detailed information on the data feature selected.
- Rectangle – drawing a rectangle will allow you to identify multiple data features on the map. For example: if you want to identify multiple schools, you can draw a rectangle around the schools that you would like to identify. Detailed information will be provided for all the data features selected on the map.
- Custom area - draw a custom shape on the map. To do so, click on the map to start drawing and double-click to finish drawing. If the shape is not closed, it will automatically connect the first and last corners.
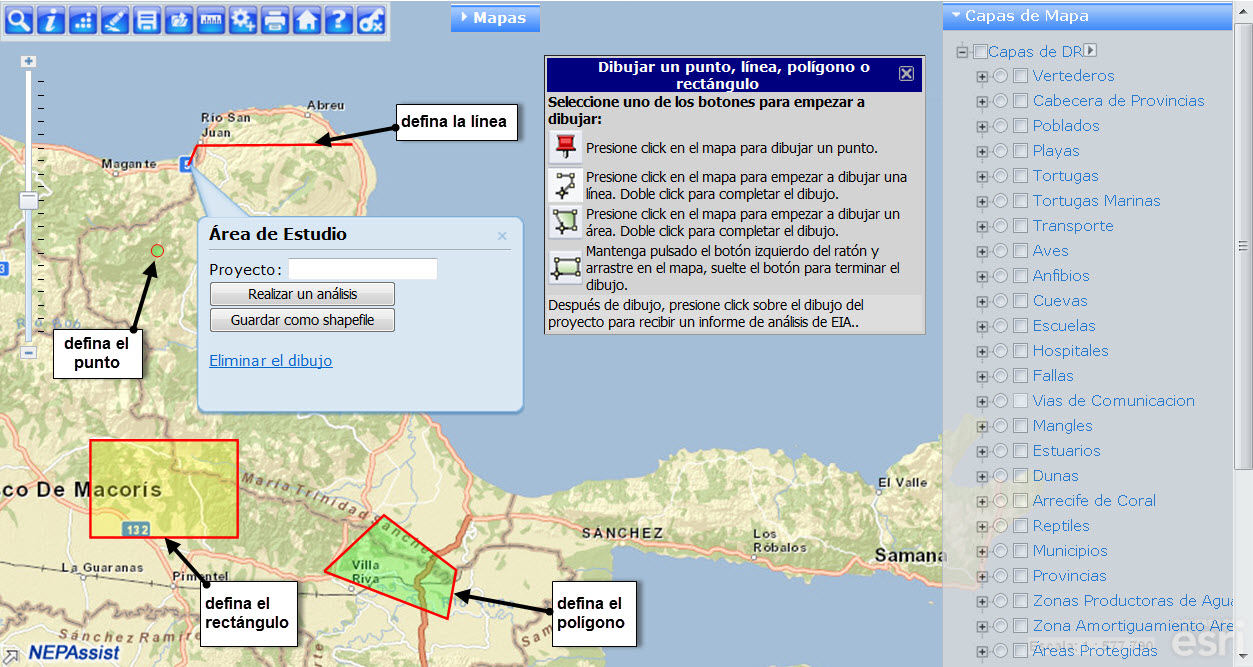
Define Report Area
You can draw an area and then generate a detailed environmental report for that area. Using this tool, you can draw a point, line, area, or rectangle.
- To start with a point, click the (
 ) button. Next, click a point on the map that you want to
define.
) button. Next, click a point on the map that you want to
define.
- To draw a line, click the (
 ) button. For each click on the map, a corner or vertex is
added and the line can change direction. Double-click to end drawing.
) button. For each click on the map, a corner or vertex is
added and the line can change direction. Double-click to end drawing.
- To draw an area, click the (
 ) button. For each click, a vertex is added. When you are
ready, double-click to set the last vertex. You must have at least three
vertices.
) button. For each click, a vertex is added. When you are
ready, double-click to set the last vertex. You must have at least three
vertices.
- To draw a rectangle, click the (
 ) button. Click and hold, then drag to adjust the size of
the rectangle.
) button. Click and hold, then drag to adjust the size of
the rectangle.
- To erase ALL drawings made on the map, click the Erase (
 )
button.
)
button.
NEPAssist Report
To generate a report using NEPAssist, you must first draw your project area on the map. For more information on drawing your project area see Define Report Area. Once you have drawn your project area, a box will pop-up over the defined area with the options to enter a project name, perform an analysis, save as shapefile, or delete the drawing.
- Delete will remove the digitized feature from the map.
- Save will allow you to save your drawing.
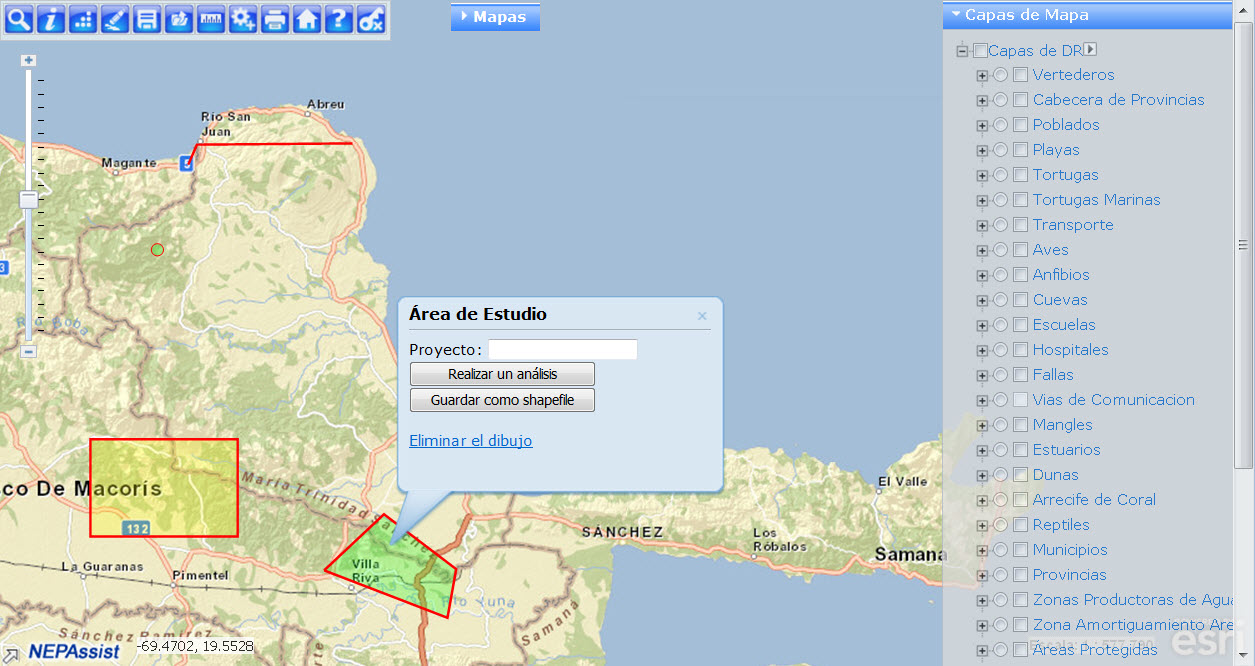
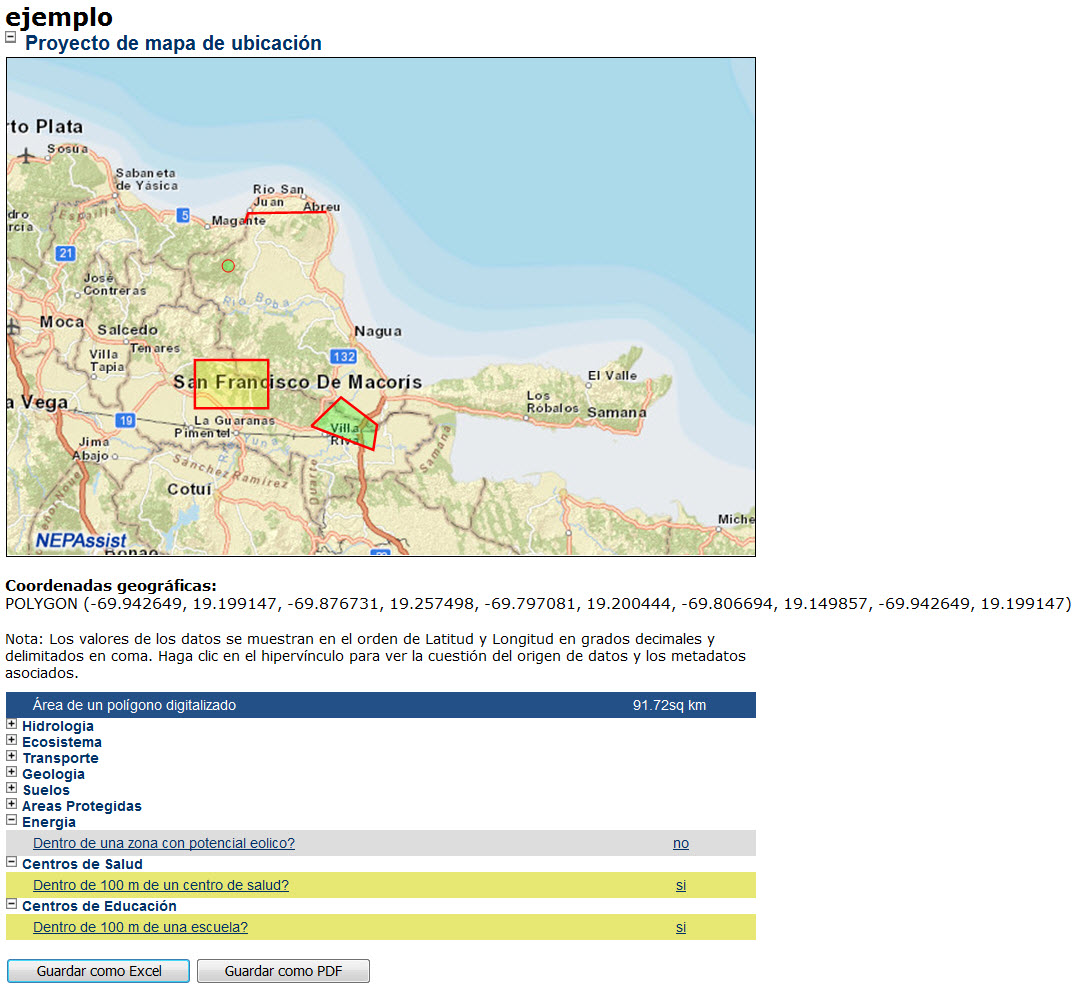
Once you click on the Perform Analysis button, a report will be generated based on environmental data available specific to your project area.
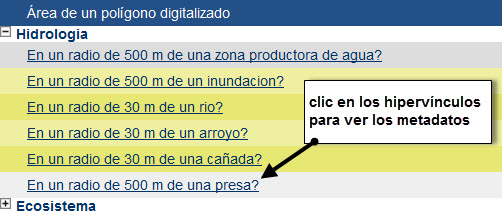
- Information in the report will be displayed as a series of questions with yes or no answers based on the location of your project area.
- Click on a hyperlinked question to view the data source and associated metadata.
- From the report page, you may also save the report as an Excel or PDF file.
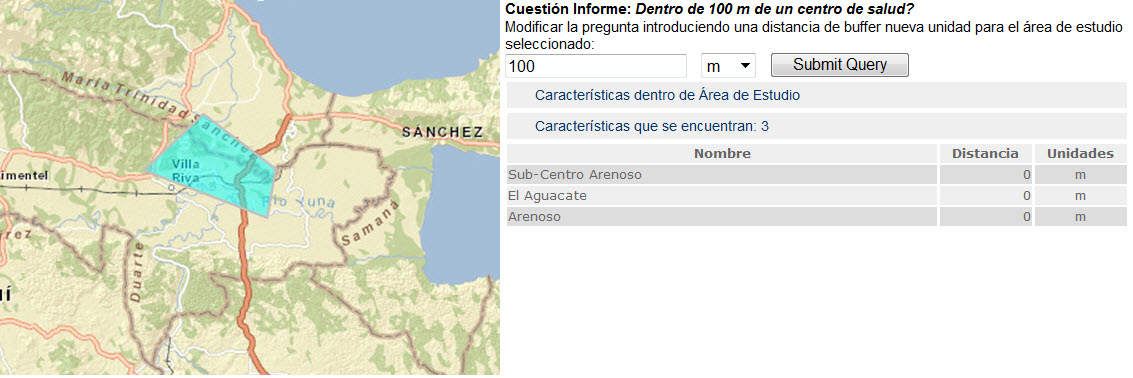
To gain additional information regarding particular questions, please click on the yes or no answer associated with that question. In a separate window, the project area map and selected question will appear with additional information, including the ability to change the buffer around the point, line or area you included in the initial report. For example: If based on your project area the initial answer to "your project area is within 1 mile of a beach site" was yes; you can click on yes and see additional information such as the name and distance of the beach site within 1 mile of your project area as well as change the buffer around your project area to see additional beach sites if applicable
Understanding the Data
The NEPAssist application draws and displays environmental data from many locations and sources to easily provide access to this information in one place.
Metadata
Each mapping layer and report question in the NEPAssist application is supported by metadata that can be viewed in the data description window. Click hyperlinks to view metadata.
Metadata describes the contents and context of the data files, including the source, the date the data was generated, accuracy, and projections. When accessing information in NEPAssist, the data file and corresponding metadata need to be referenced by the user. Do not reference the NEPAssist application directly because data layers within NEPAssist are continually updated and refreshed when more current data is available.
Top of page | Print Page | Close Window
Other Tools
Printing
To print your map, click the Print ( )
button.
)
button.
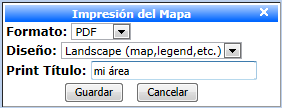
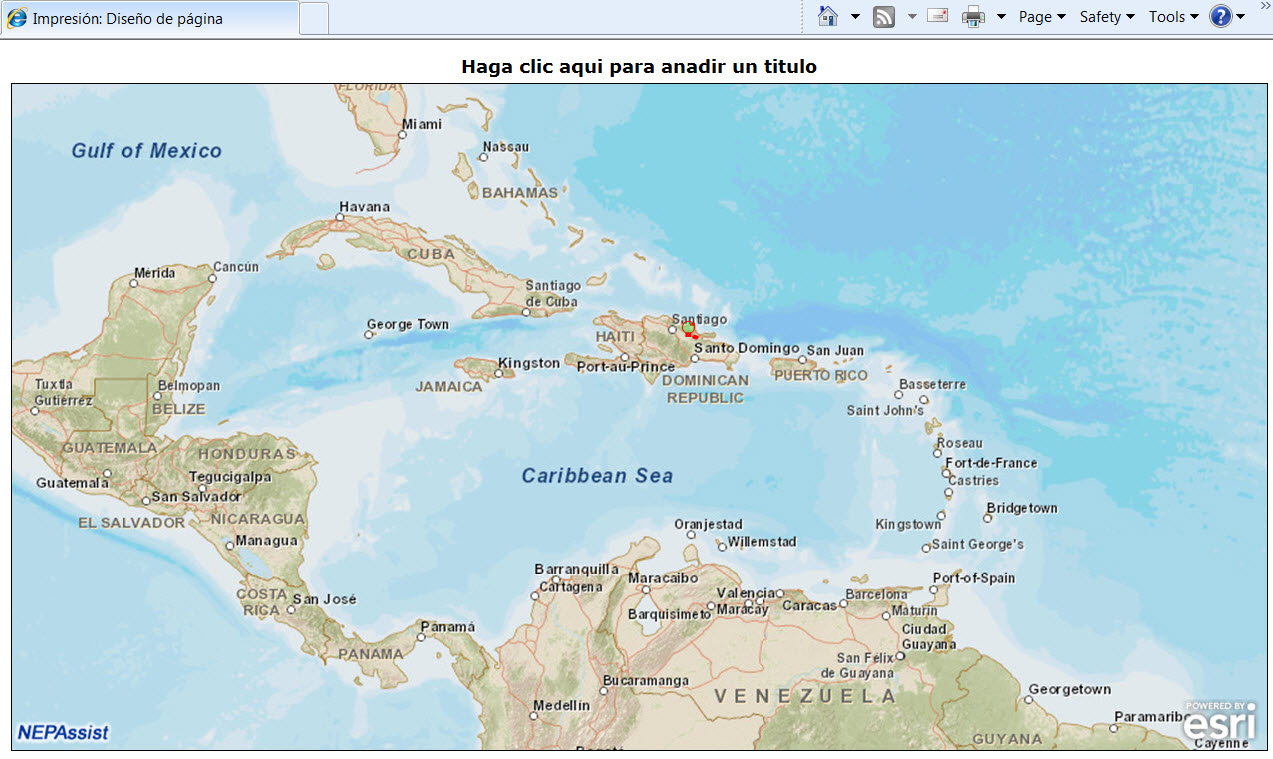
You can print a map in three formats of image only, PDF, or HTML. By default, the current displayed map size is used. But you can define your own map size. If PDF or HTML is chosen, a landscape or portait layout become available. You can enter a title for the map as well.
Use your browser's print function to send the map to a printer.
Usage Note: Some layers may not appear in the printout of your map. Currently there are limitations using the Print tool. The NEPAssist mapper layers are provided by multiple map services. It uses transparency properties to display layers from multiple services. Browsers can interpret transparency in HTML documents, however printers cannot interpret the transparency properties for display purposes. The result is that only the top layer will be visible on the printed page.
Alternate print method: If the resulting printout is insufficient for your use, please press ALT-PrintScreen (for PC users) to capture the image, and CTRL-V to paste it into an editor for presentation.
Measurements
Click the Measure ( )
button in the toolbar.
)
button in the toolbar.
- To measure a distance, click on the line (
 )
button in the measure pop-up. Then click on the map to start drawing a line.
Double-click to end the line.
)
button in the measure pop-up. Then click on the map to start drawing a line.
Double-click to end the line.
- To measure an area, click on the area (
 )
button in the measure pop-up. Then click on the map to start drawing an area.
Double-click to end the drawing.
)
button in the measure pop-up. Then click on the map to start drawing an area.
Double-click to end the drawing.
Upload Shapefile
Click the Upload Shapefile ( )
button in the toolbar.
)
button in the toolbar.
- Select a shapefile and related files from your desktop by pressing "Browse." The file name must be the same with different extensions.
- Click "Upload" to upload the file onto the server. (The shapefile must be in the Geographic projection, not Conformal Conic.)
You may also select an existing shapefile from the server for analysis.
Add Layer
You can add a layer ( )
of map service by specifying a known service or searching ArcGIS Online.
)
of map service by specifying a known service or searching ArcGIS Online.
- To specify a known service, you must select the type of service and the sampling site, and enter the URL and description. You may also set the transparency of the layer.
- To search online, enter key words.
Save Session
You may save a current job by clicking the Save Session ( )
button in order to access it later.
)
button in order to access it later.
- To access the saved file,
- Go to the Home Page
- Click the "Saved Sessions" tab and find the file.
- Click file name to open.
- To start a new session, click on the Home Page (
 )
button. To end your session, click Log Out (
)
button. To end your session, click Log Out ( ).
).
Also, if you receive an email with a link to a project within GIS, you will
have the option to change the project area.
Top of page | Print Page | Close Window